
ComplexDataMadeClear&Actionable

- Deliverables
- UX/UI Design, Dashboard Design
- Industries
- Data & Analytics
- Tools
- Figma
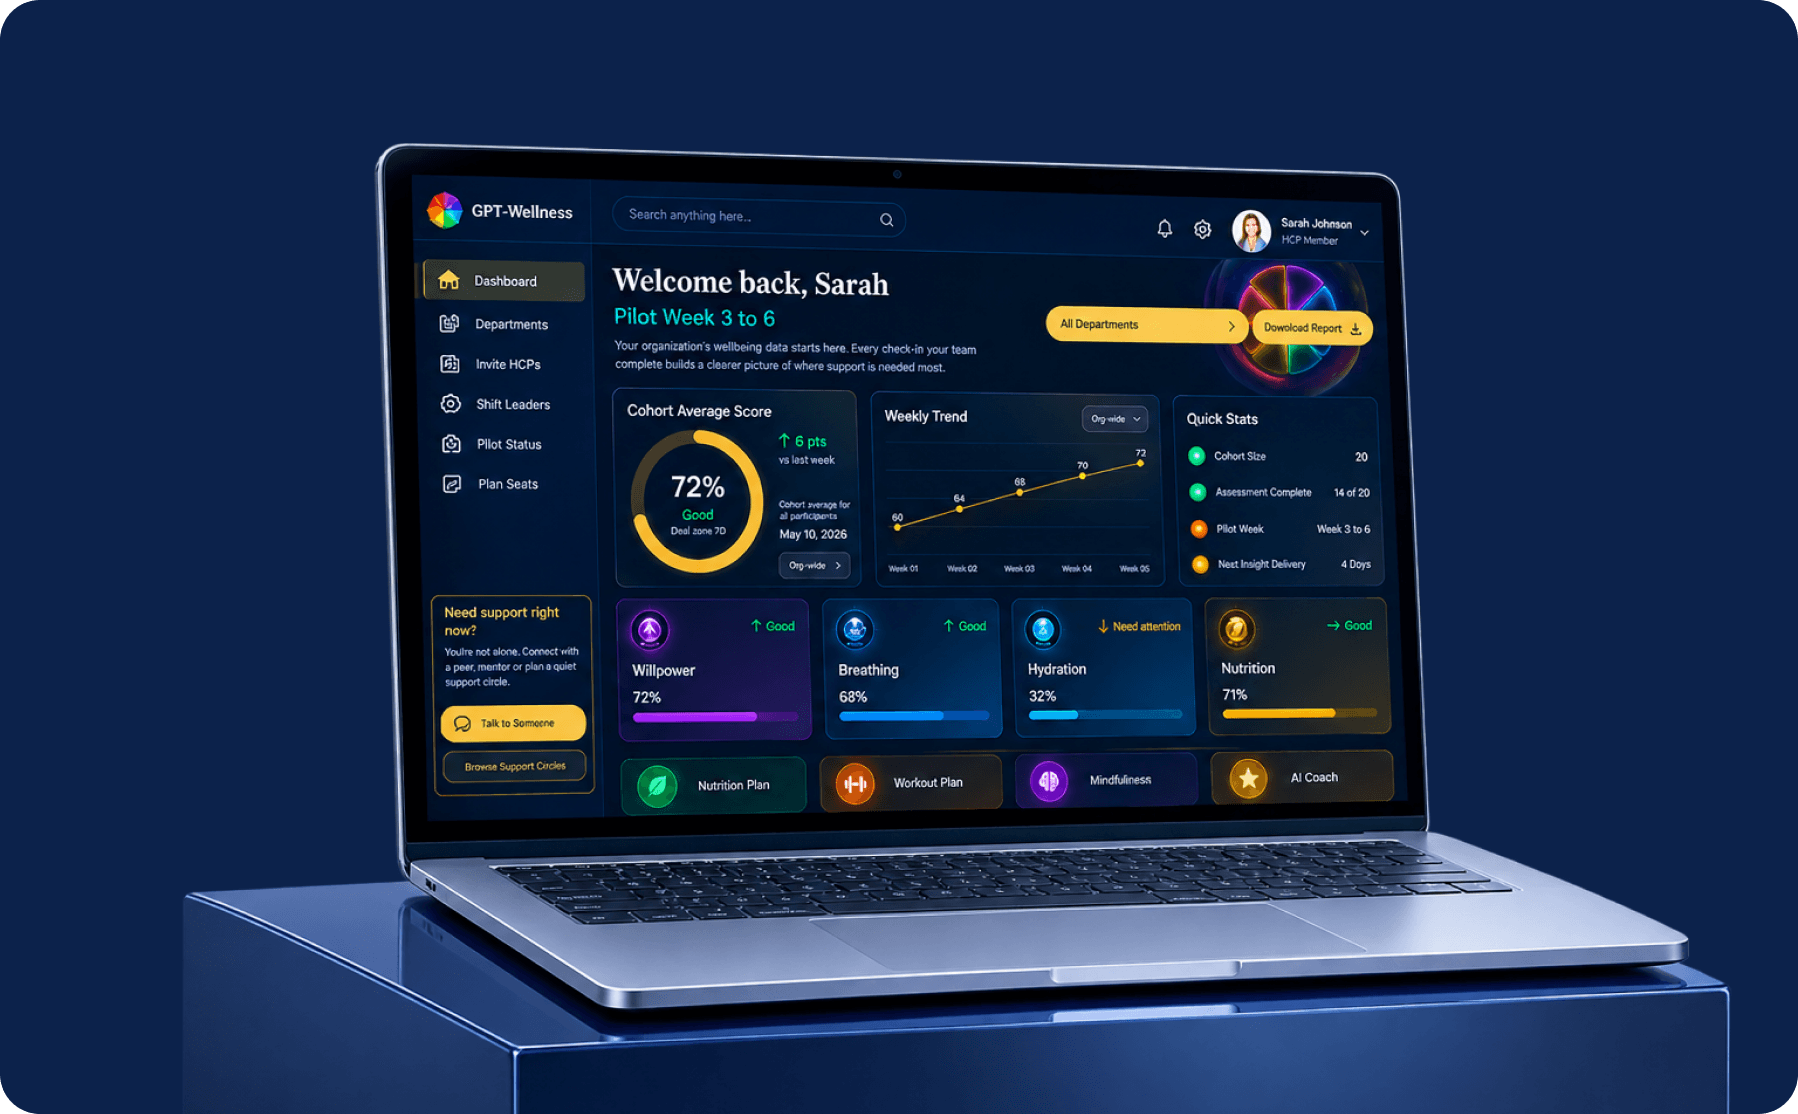
Turning Complex Data Into Clear Everyday Insights
Merismetric brings complex operational data together within one structured dashboard, helping teams understand performance and manage everyday workflows more efficiently.
Desyniq designed the experience around clarity and accessibility—organizing metrics, reports, results, transactions, and user activity into an interface that makes important information easier to find, understand, and act on.
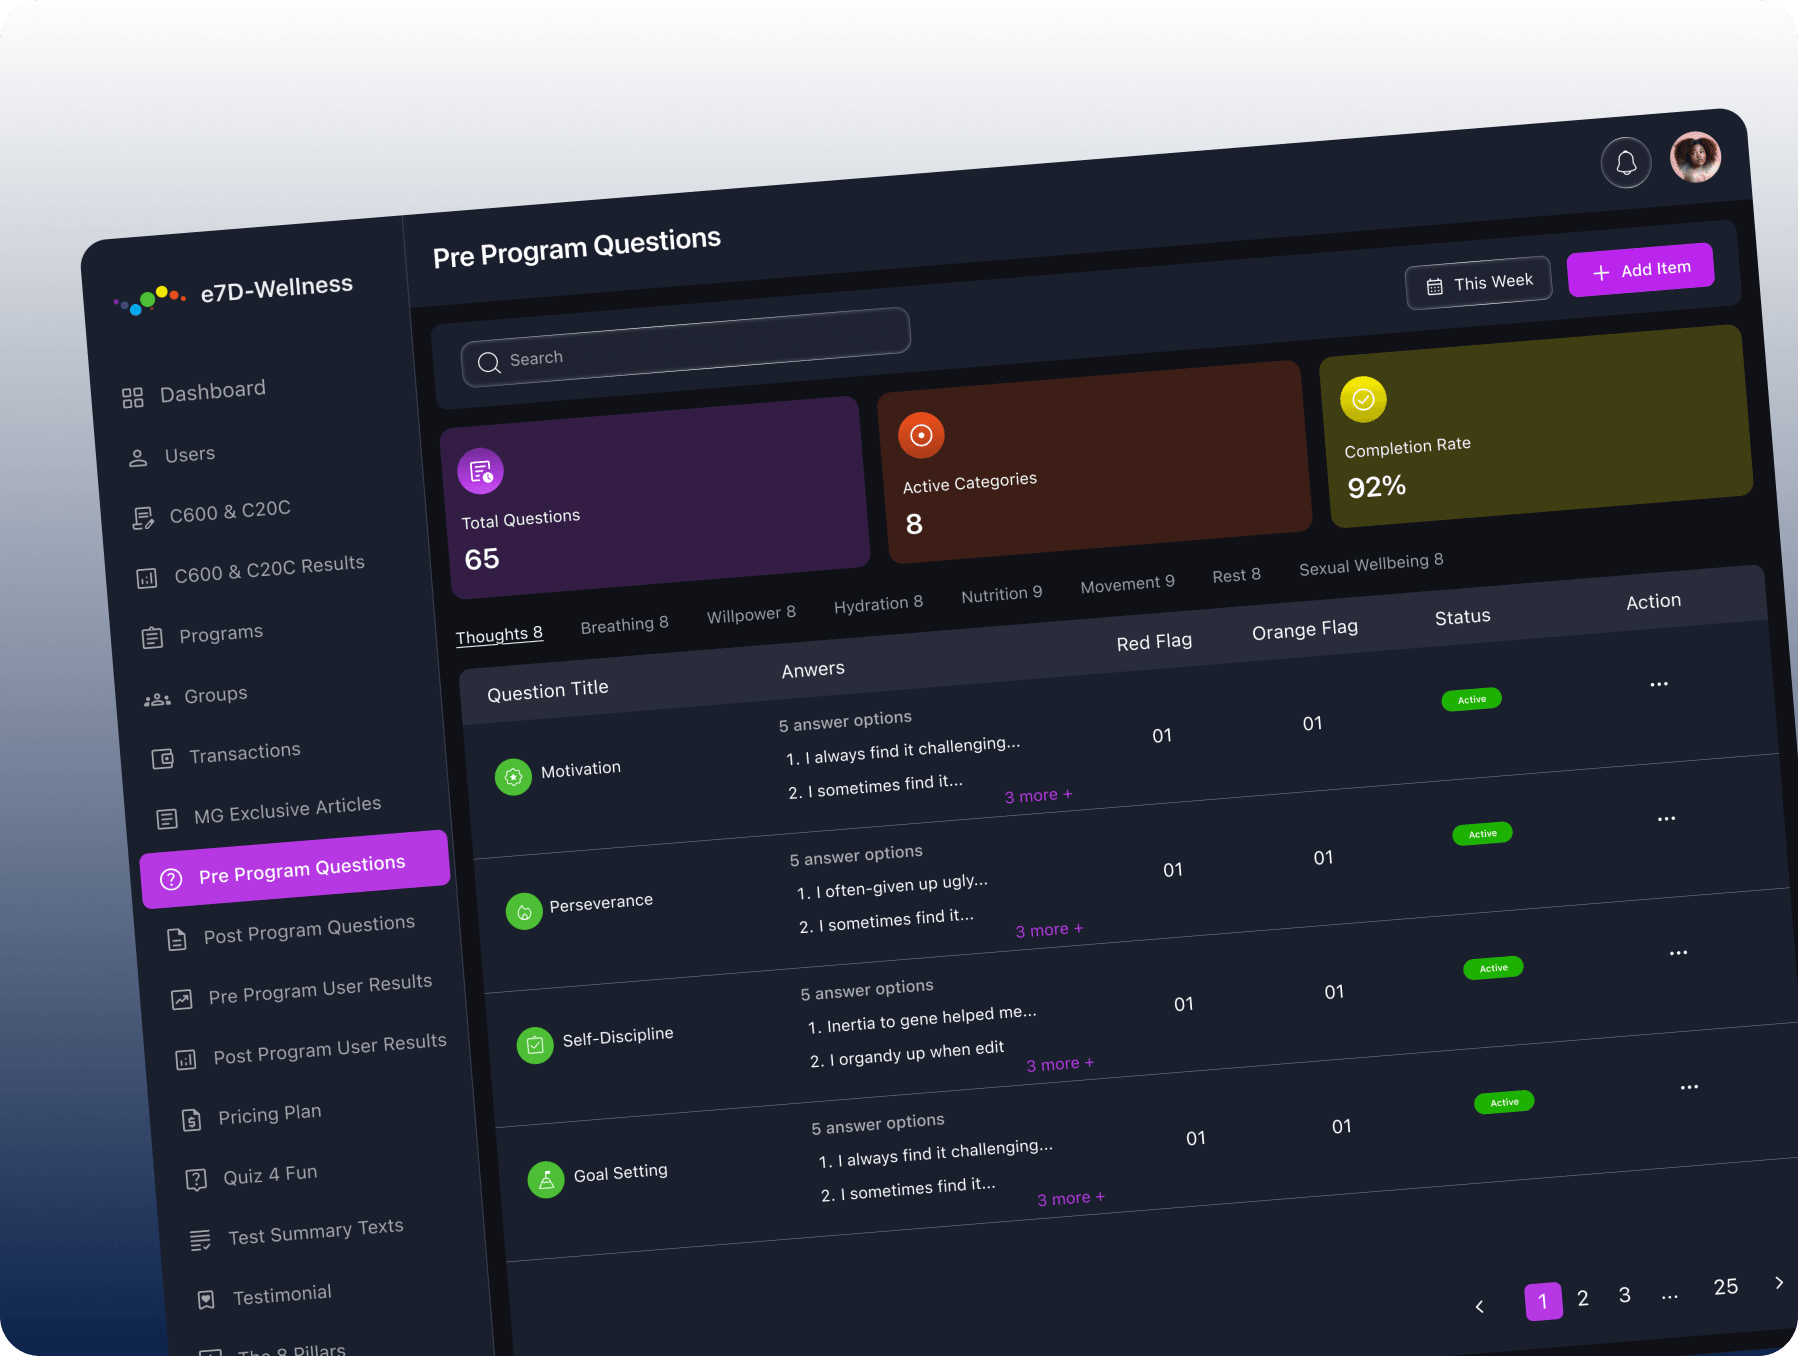
Problem Statement
Merismetric handles large amounts of information across users, programs, results, transactions, and performance metrics. The challenge was presenting this data without making the dashboard feel dense, complicated, or difficult to navigate.
Hypothesis
By reducing visual complexity and prioritizing the most relevant information, users could interpret data faster, navigate between workflows more confidently, and spend less time searching for important insights.
Solution
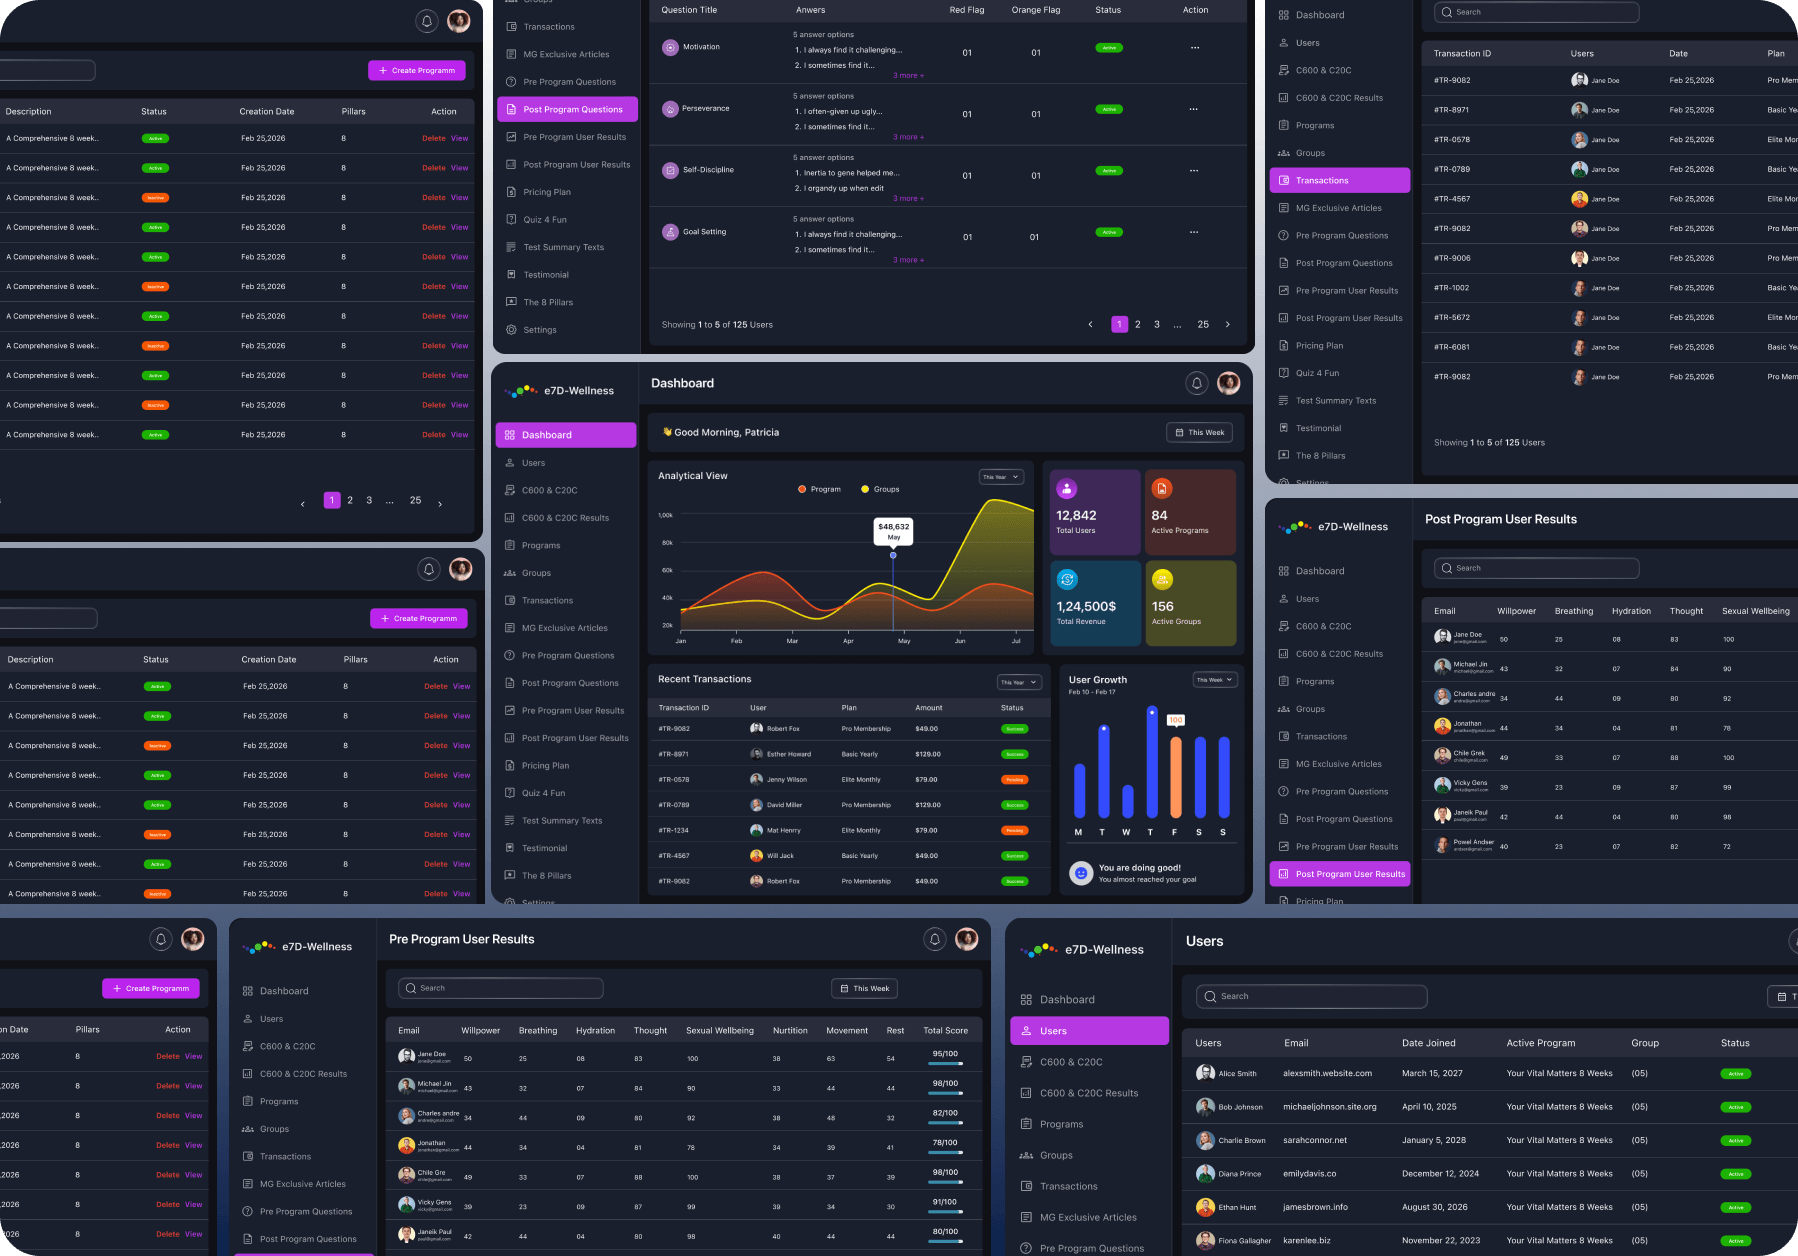
Desyniq created a structured dashboard system with clear navigation, focused data hierarchy, and reusable components. Key information is surfaced through charts, tables, status indicators, and summary cards, helping users understand what matters at a glance.
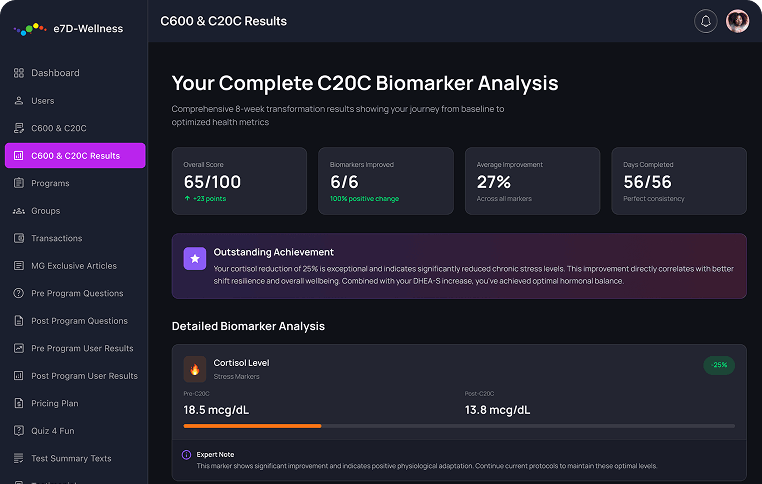
Collaboration at core and outstanding delivery
Close collaboration helped us understand Merismetric’s complex workflows and determine how different layers of information should connect across the platform.
Desyniq translated these requirements into a consistent dashboard experience—refining navigation, data hierarchy, reporting views, and reusable components to make everyday tasks feel more organized and manageable.
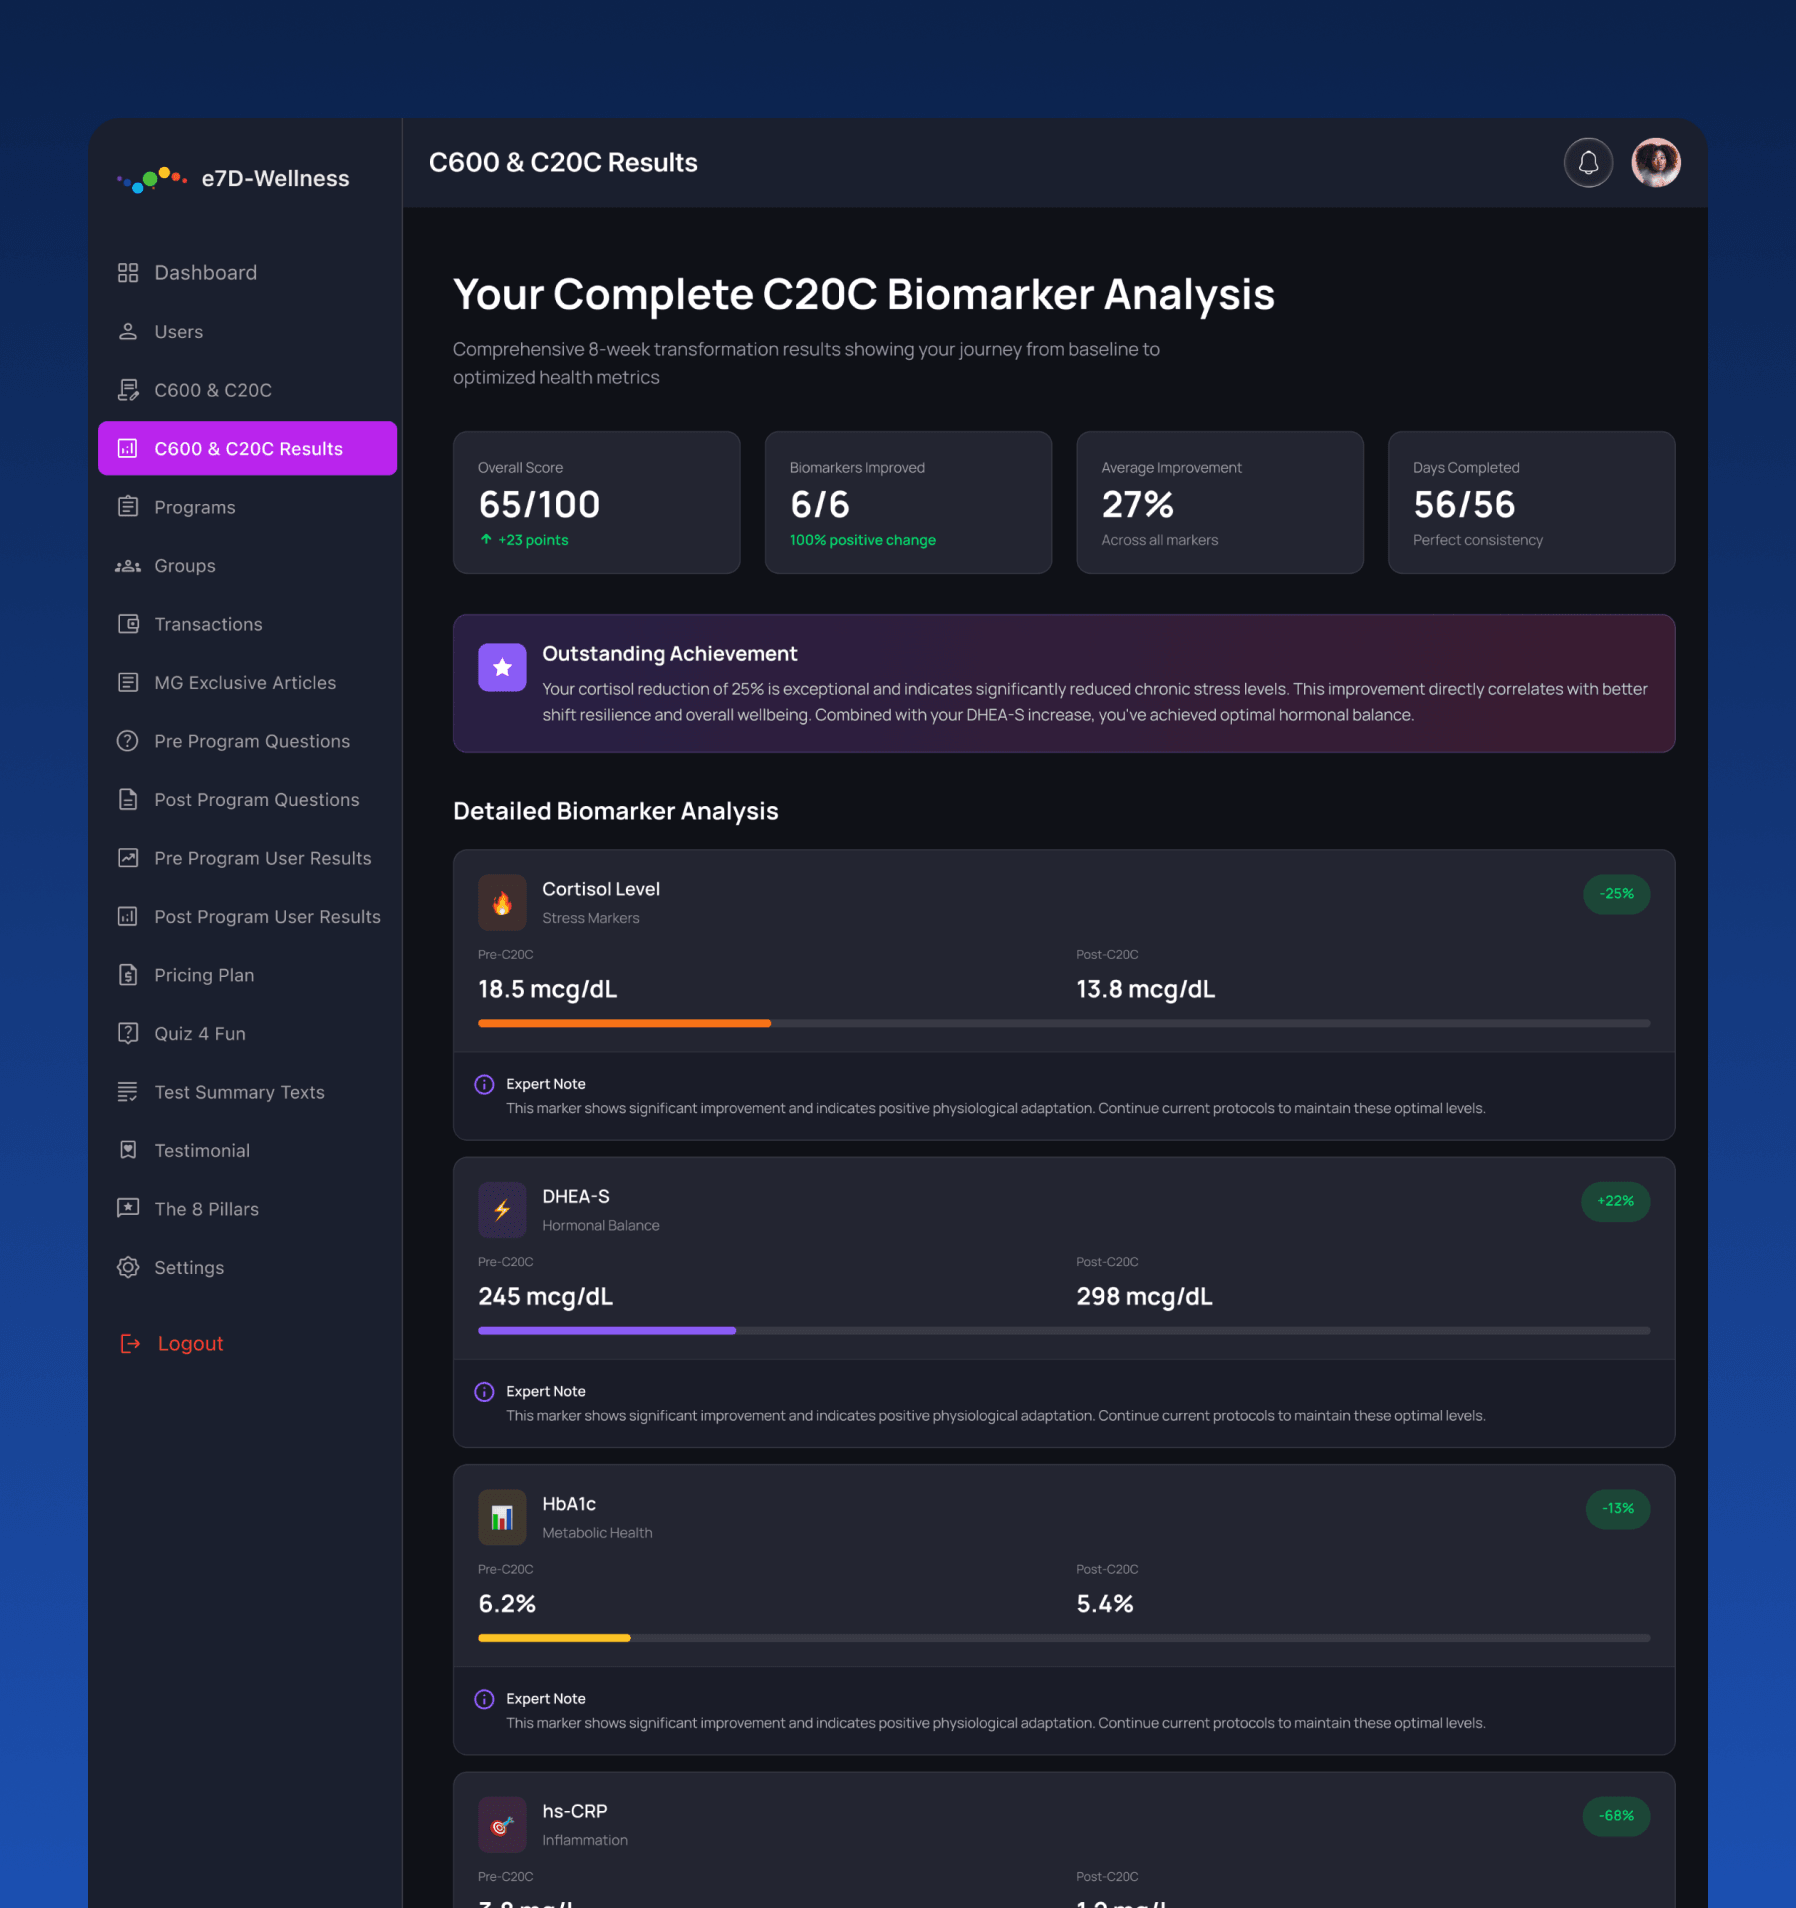
Smarter Insights for Everyday Decisions
Merismetric transforms detailed information into a structured experience that helps teams understand performance without unnecessary complexity.
From high-level metrics and analytical charts to program results, transactions, and user data, every screen was designed to surface the right information at the right time—helping users monitor progress and make informed decisions with confidence.
What impressed us most about Desyniq was their ability to turn complex data into a dashboard that feels effortless. Merismetric now has a structured, visually balanced interface where insights are clear, accessible, and easy to explore.
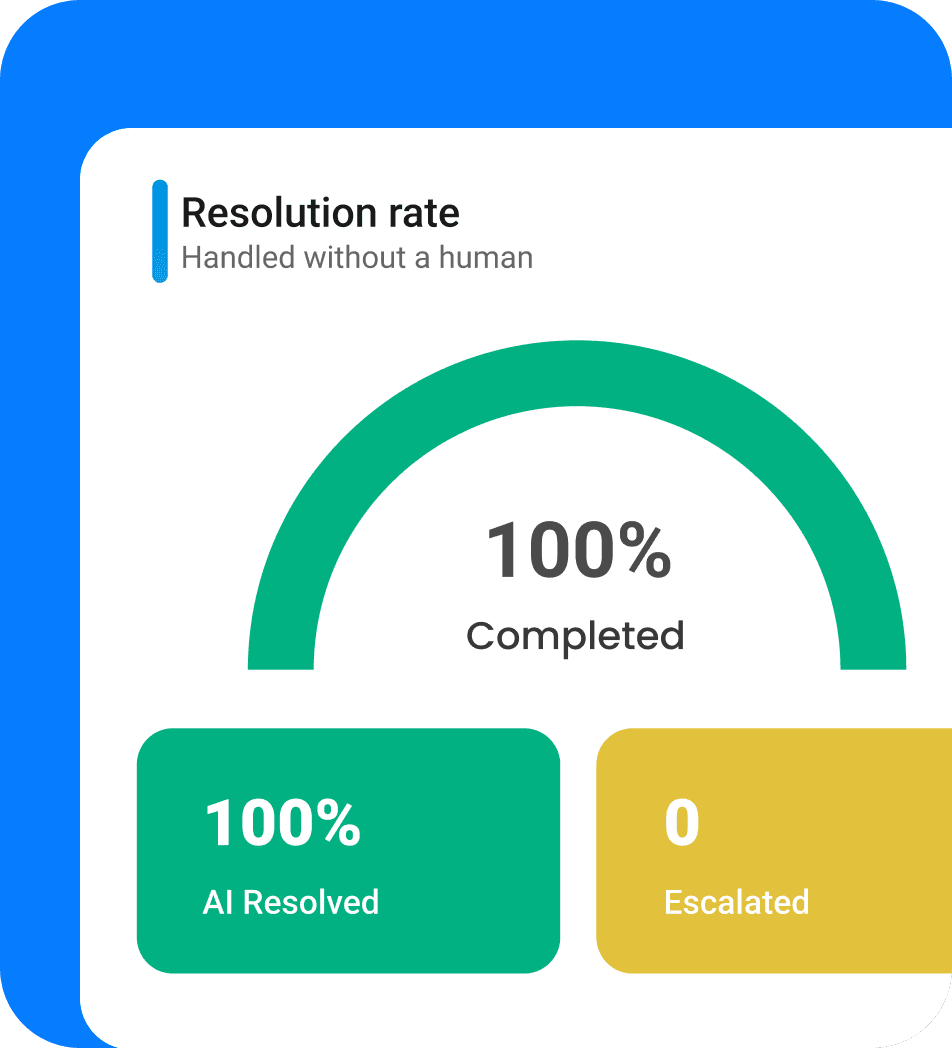
Designed for
360°
Data Visibility & Control
Our process
From Idea to Impact
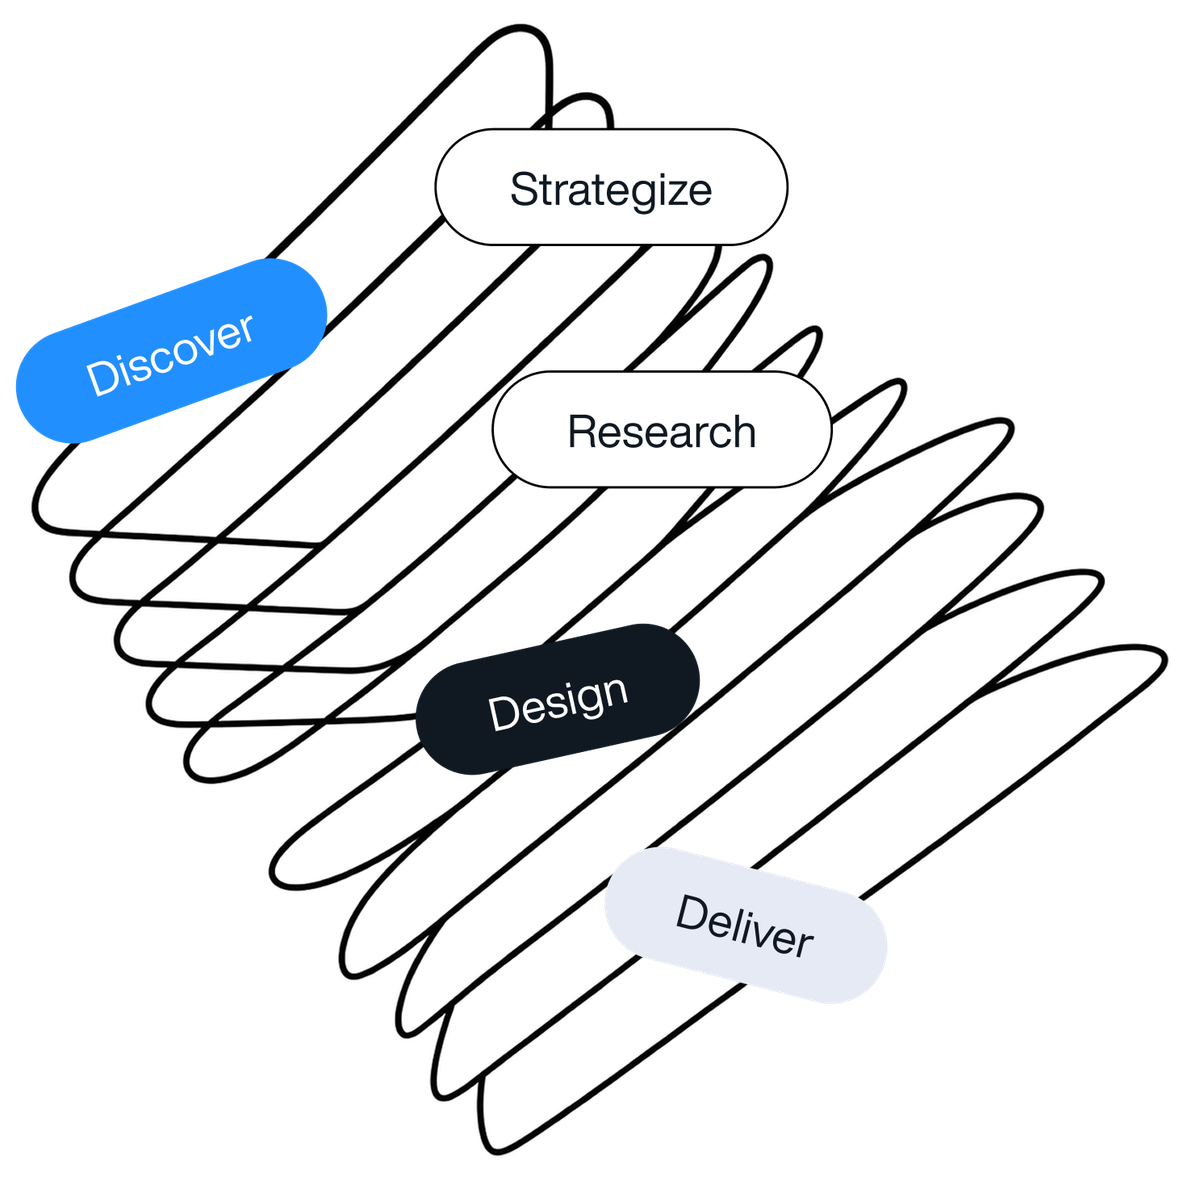
Refining responsive screens, interaction states, reusable components, and developer-ready design assets.
Contact us
Reach out, we’re ready to collaborate
Leave your message and we will get back to you shortly